Dashboards and Story Maps
LTAR Network data visualization and story toolsLTAR Data Inventory Insights Dashboard
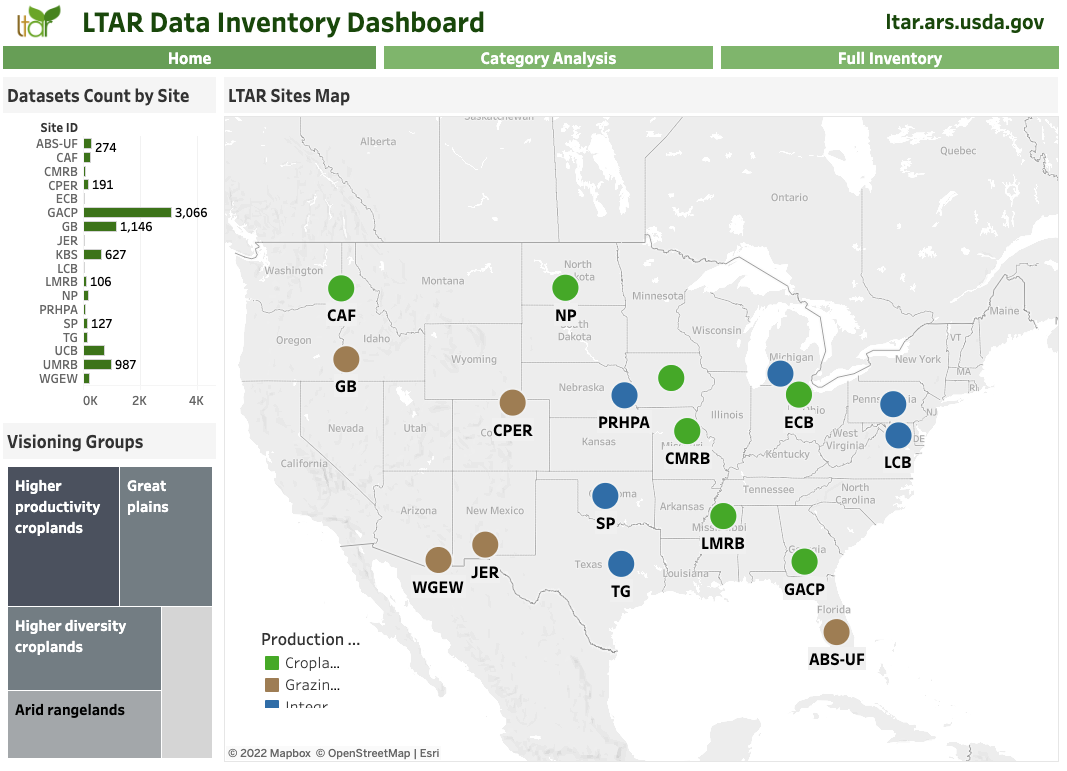
LTAR Data Inventory Insights Dashboard
There is a current network-level effort to inventory all cross-domain datasets for LTAR. The purpose of the LTAR Data Inventory project is to enable the 18 LTAR sites to outline data holdings that will enhance data discoverability and data sharing across the LTAR network. The following dashboard provides various views of the LTAR Data Inventory (click on image to open dashboard).
Soil Attribute Discovery Tool
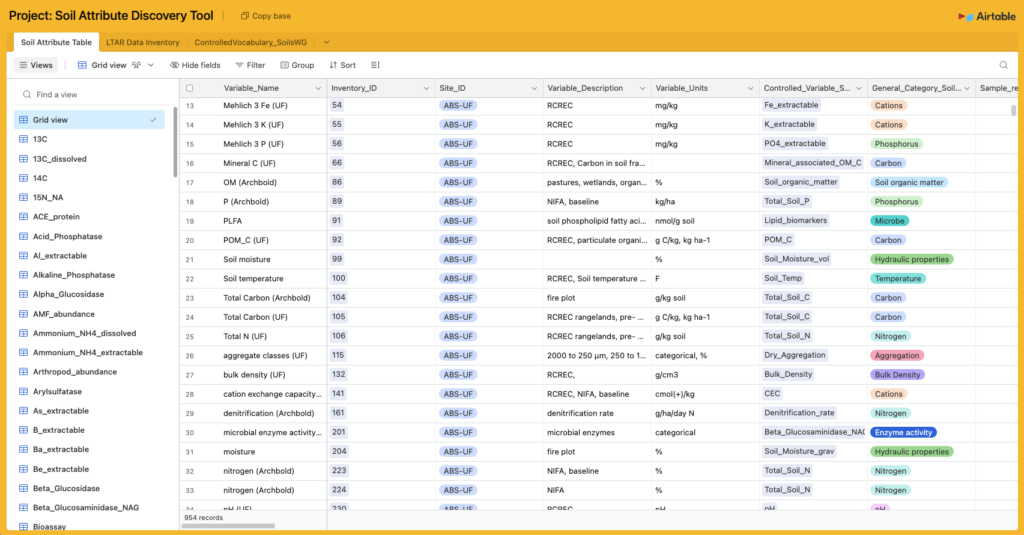
Soil Attribute Discovery Tool
The purpose of the LTAR Soil Attribute Discovery Tool is to aid in data discovery and assessment of soils data within the LTAR network.
LTAR Standard GIS Data Layers Dashboard
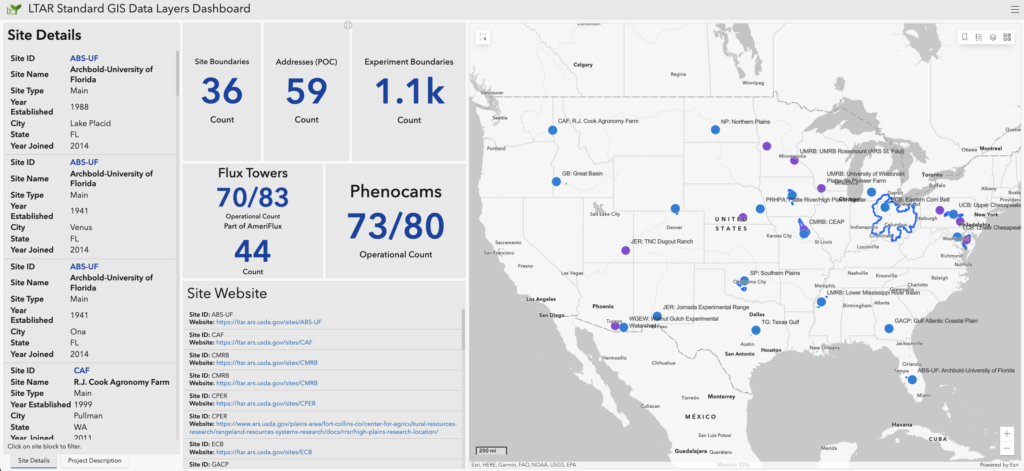
LTAR Standard GIS Data Layers Dashboard
This effort created a geodatabase of standard GIS layers that represent locations and areas associated with the USDA Long-Term Agroecosystem Research (LTAR) Network as of 2021. The geodatabase includes spatial data describing LTAR site locations, addresses, experimental plots, fields and watersheds, eddy flux towers, and phenocams. There are six data layers in the geodatabase available to the public. This geodatabase wascreated in 2019-2020 by the LTAR network as a collaboration between the LTAR Remote Sensing and GIS working group and the LTAR Data Management working group. The process to create the geodatabase began with initial requests to LTAR site leads and data managers for geospatial data, followed by meetings with each LTAR site to review the initial draft. Edits were documented, and the final draft was again reviewed and certified by LTAR site leads or their delegates. Revisions to this geodatabase will occur biennially, with the next revision scheduled to be published in 2023.
An exploratory dashboard of the GIS layers reviewed by the 18 LTAR sites (click on image to open dashboard):
A web map with the 6 GIS layers is also available here.
Dataset DOI, obtained from Ag Data Commons: 10.15482/USDA.ADC/1521161
LTAR Publications Dashboard
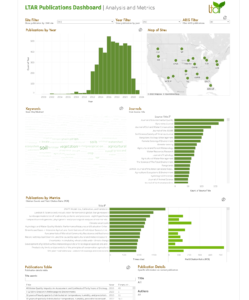
LTAR Publications Dashboard
This LTAR Publications Dashboard harmonizes and visualizes disparate lists of LTAR publications:
LTAR Story Maps
The LTAR Network StoryMap
Story Maps play an important role in communicating the work of the LTAR Network by transforming complex agricultural and environmental research into clear, engaging visual narratives. Through interactive maps, imagery, and on-the-ground insights, Story Maps help connect data to the real landscapes and communities where LTAR scientists work.
By making science more accessible and place-based, Story Maps support collaboration among researchers, producers, policymakers, and the public. Explore Story Maps from across the LTAR Network to learn how each site is advancing solutions for agriculture and the environment:
Discover LTAR Story Maps: https://ltar-usdaars.hub.arcgis.com/search?tags=story%2520map
ABOUT LTAR
The USDA Agricultural Research Service (ARS) Long-Term Agroecosystem Research network consists of 18 Federal and university agricultural research sites with an average of over 50 years of history. The goal of this research network is to ensure sustained crop and livestock production and ecosystem services from agroecosystems, and to forecast and verify the effects of environmental trends, public policies, and emerging technologies.